Trip Distribution Map
To dynamically visualize trip distribution patterns in a Map:
- Right-click on Map Layers
- Select the polygon layer in the Data Source tab.
- Select the appropriate field from those available from the loaded polygon in the Zone field drop-down
- Select the matrix file containing the trip information that you wish to load into the Dynamic layer
- Choose the appropriate table from the ones available in the Matrix table drop-down.
- Select which value you wish the Dynamic Layer to show:
- Click Apply
Select any of the zones from the boundary layer.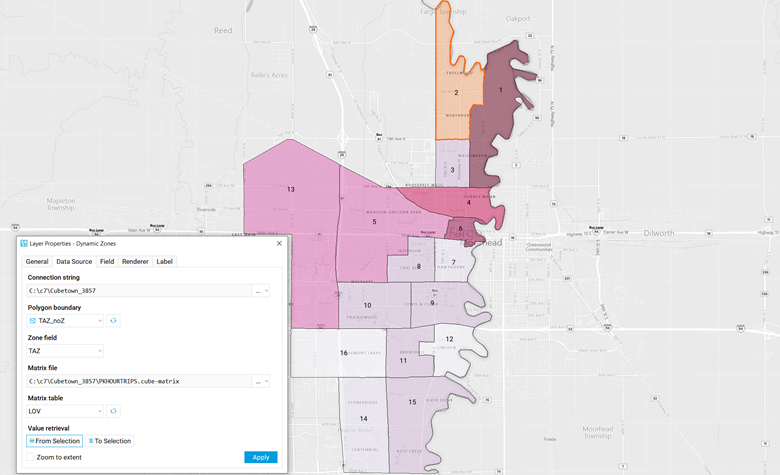
The selected zone will be outlined and the other zones will be colored in a density based gradient of trips generated from/to the selected zone.
Dynamic Zone layers will vary depending on the zone that has been selected and can be customized:
- Go to the Layer Properties window for the Dynamic Zone
- Click on the
Renderer
tab.
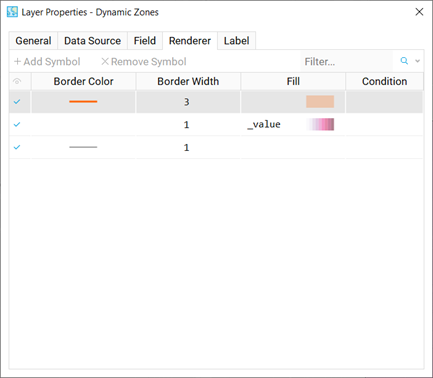
- There are three symbols added by default: the selected zone symbol, the variable zone coloring symbol and the zone boundary symbol.
- You can customize any of the symbols by right-clicking on the setting you wish to change.
For example:
To add labels to the zones:
- Click on the Label tab
- Right-click on the ABC symbol and select the variable you wish to display
- Customize the label with the available options